Nagios vs. Sensu: Comparing Monitoring Solutions
When it comes to monitoring your network, choosing the right tool can make all the difference. With the plethora of options available, it’s essential to find a solution that meets your specific needs and requirements. In this article, I will delve into the world of Nagios and Sensu, two popular open source monitoring tools, and compare their performance, features, and usability. So, which one is better – Nagios or Sensu? Let’s find out!
Key Takeaways:
- Nagios and Sensu are both powerful monitoring solutions with distinct features and capabilities.
- Nagios is well-suited for a Linux environment and can be integrated with Opscode Chef for system integration.
- Sensu offers a user-friendly UI and API, making it suitable for auto-scaling cloud deployments.
- Nagios has a larger user community and offers extensive documentation and support.
- Sensu provides a modern UI and API but may have limited documentation and support options.
Understanding Nagios
Nagios is a widely used monitoring framework that plays a crucial role in maintaining the stability and performance of systems in a Linux environment. With its powerful Nagios core, this monitoring framework offers a robust solution for organizations seeking to ensure the reliability of their IT infrastructure.
One of the key features of Nagios is its scalability. With the ability to monitor multiple systems and devices simultaneously, Nagios can effortlessly handle the complexities of large-scale environments. Whether you have hundreds or thousands of servers, Nagios can efficiently collect and analyze data to provide real-time insights into the health of your network.
When it comes to configuration, Nagios utilizes configuration files on the Nagios server. All checks, handlers, and hosts need to be written in these configuration files. While this approach offers flexibility and control over monitoring configurations, it does require manual updates to the files whenever changes are made, such as adding or removing hosts. Additionally, a restart of Nagios is necessary to apply these configuration changes effectively.
“Nagios is a monitoring framework that provides comprehensive control and monitoring capabilities for network environments. Its configuration files allow for precise monitoring customization, making it a powerful tool for system administrators.”
Nagios is often integrated with Opscode Chef, a powerful configuration management tool. This integration allows for seamless system integration, making it easier to manage and monitor various aspects of your infrastructure.
To summarize, Nagios is a monitoring framework that excels in a Linux environment, offering scalability and precise control over configurations through configuration files. By integrating Nagios with Opscode Chef, system administrators can further enhance their monitoring capabilities and streamline operations.
Image: Nagios Architecture
Exploring Sensu
Sensu is a newer monitoring tool that offers a user-friendly UI and API. It provides a modern and intuitive experience for users, making it easy to navigate and configure monitoring settings. With Sensu, you have full control over your monitoring stack, allowing you to customize it according to your specific needs.
When setting up Sensu, there are a few additional dependencies to consider. Redis and RabbitMQ are required components in the Sensu monitoring stack. Redis, an in-memory data structure store, serves as a message broker for data passed between Sensu components. RabbitMQ, on the other hand, is used as a message queue to enable efficient communication between the different parts of Sensu.
By leveraging these dependencies, Sensu is able to handle large amounts of monitoring data while ensuring reliability and scalability. This makes it an ideal choice for organizations with auto-scaling cloud deployments, where hosts come and go frequently. Sensu’s “subscriber” model allows hosts to subscribe to specific checks based on their role or purpose, enabling dynamic monitoring in dynamic environments.
Key Features of Sensu:
- User-friendly UI and API
- Customizable monitoring stack
- Integration with Redis and RabbitMQ
- Supports auto-scaling cloud deployments
- Flexible “subscriber” model for dynamic monitoring
With Sensu, monitoring becomes a seamless and efficient process. Its intuitive interface and powerful features make it a compelling choice for organizations seeking to optimize their monitoring capabilities.
Overall, Sensu offers a reliable and scalable solution for monitoring your infrastructure. Its user-friendly UI, extensive customization options, and support for auto-scaling cloud deployments make it a valuable tool in today’s dynamic IT landscape.
Performance Comparison
When it comes to monitoring performance, both Nagios and Sensu offer reliable solutions for various needs. Nagios, known for its stability, has been widely used in large-scale environments with hundreds or even thousands of servers. Its robustness ensures efficient monitoring across complex infrastructures.
Sensu, on the other hand, brings scalability and flexibility to the table, making it a suitable choice for dynamic cloud environments. With Sensu, organizations can easily adapt their monitoring systems to meet changing demands and scale up or down as needed.
Response time and resource usage are crucial factors when evaluating monitoring tools. Nagios and Sensu can perform well in these areas, but their efficiency depends on proper configuration and alignment with specific monitoring requirements.
Both systems have proven their effectiveness in monitoring environments, enabling real-time insights and alerts. Nagios has a proven track record, especially in larger infrastructures, while Sensu shines in its ability to handle the complexities of cloud environments.
Ultimately, the choice between Nagios and Sensu will depend on the unique needs and preferences of your organization. Consider factors like scalability, response time, and resource usage in your decision-making process to find the monitoring solution that best fits your requirements.
“Nagios’s stability has made it the go-to choice for monitoring large-scale environments with numerous servers.”
Feature Comparison
When it comes to monitoring, both Nagios and Sensu offer an impressive array of features to meet your needs. From checks and handlers to a comprehensive dashboard, these tools have you covered. Let’s take a closer look at what each one brings to the table.
Nagios Features
- Nagios boasts a wide range of plugins, making it a versatile choice for monitoring various systems, especially Linux-based environments. These plugins enhance Nagios’ functionality and allow for specific monitoring requirements.
- With Nagios, you have access to a powerful dashboard that provides an intuitive visual representation of your monitoring data. This feature allows you to quickly identify trends, patterns, and potential issues.
- Nagios offers extensive plugin support, allowing you to extend its capabilities and customize your monitoring setup to meet your unique needs or integrate with existing systems.
- Visualizations in Nagios are designed to provide a clear and concise overview of your monitoring data. Through graphs, charts, and other visual elements, you can gain insights and track the performance of your systems effectively.
Sensu Features
- Sensu supports Nagios plugins, ensuring compatibility for those who are familiar with or have existing Nagios setups. This seamless integration makes it easier for users to transition from Nagios to Sensu.
- A user-friendly UI and API are among the standout features of Sensu. The intuitive interface makes it easy to navigate and configure your monitoring settings. With its straightforward design, both beginners and advanced users can take full advantage of Sensu’s capabilities.
- Like Nagios, Sensu also offers a range of visualizations to make sense of your monitoring data. These visual elements provide actionable insights and help you identify issues at a glance.
- Plugin support in Sensu allows you to extend its functionality and integrate with other tools seamlessly. This flexibility ensures that you can tailor your monitoring setup to fit your specific requirements.
Ultimately, the choice between Nagios and Sensu comes down to evaluating which features align best with your monitoring needs. While Nagios shines in terms of plugin availability and its extensive monitoring ecosystem, Sensu offers a more modern and user-friendly experience. Consider your specific requirements and preferences to make an informed decision.
“Nagios and Sensu offer a range of features for monitoring, including checks, handlers, and visibility through a dashboard.”
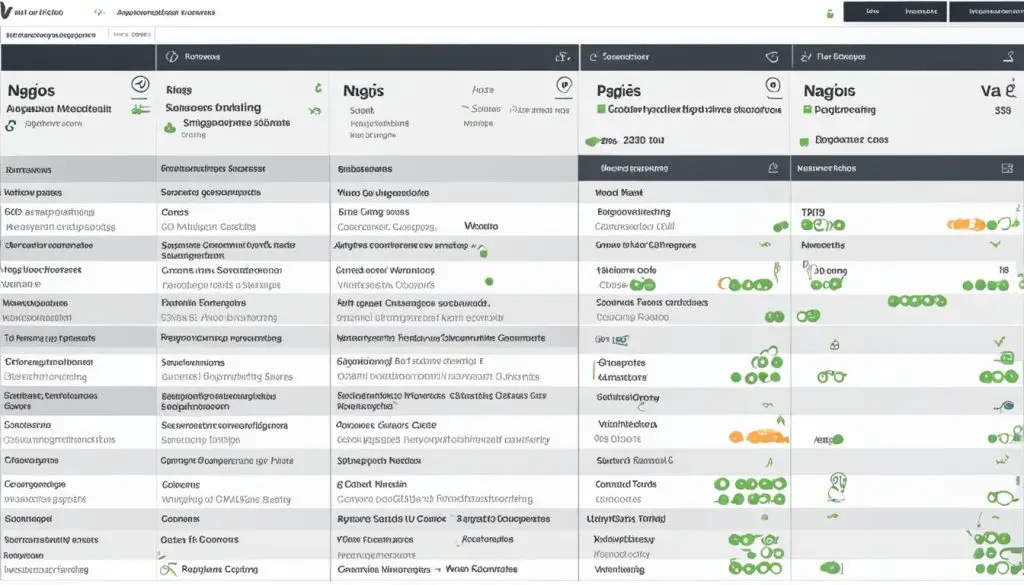
To give you a visual representation of the differences, here’s a comparison table:
| Feature | Nagios | Sensu |
|---|---|---|
| Plugin Availability | Wide range of plugins | Supports Nagios plugins |
| Dashboard | Comprehensive and customizable | User-friendly design |
| Plugin Support | Extensive plugin ecosystem | Flexible plugin integration |
| Visualizations | Clear and concise data representation | Actionable visual insights |
User Experiences
When it comes to user experiences, Nagios and Sensu offer their own advantages and drawbacks. As with any software, user preferences and individual needs play a significant role in shaping these experiences.
Nagios, with its longstanding reputation and extensive user community, boasts a wealth of resources in terms of documentation and support. Users can rely on the vast knowledge base, forums, and online communities that have evolved around Nagios over the years. The comprehensive documentation available for Nagios helps users navigate through the intricacies of the tool, providing valuable insights and troubleshooting guidance.
However, it’s worth noting that some users may find Nagios challenging to configure, especially for those new to the software. The multitude of configuration files and the need to manually update them can be overwhelming for beginners. Additionally, some users have expressed dissatisfaction with Nagios’ user interface, considering it outdated compared to the modern standards set by newer monitoring tools.
On the other hand, Sensu, being a relatively newer tool, offers a more contemporary user interface (UI) and application programming interface (API). Its UI is designed to be intuitive and user-friendly, making it easier for users to navigate and configure the tool. Sensu’s modern approach, coupled with its straightforward setup process, can make it a more attractive option for those seeking simplicity.
However, due to its relatively recent introduction to the market, Sensu may not have the same level of extensive documentation and community support as Nagios. Users may find fewer online resources and might have to rely more on official documentation or customer support channels provided by Sensu.
“Nagios has a well-established community and extensive documentation, which is great for users who need access to a wealth of resources. However, the configuration complexity and outdated UI may pose challenges for some. Sensu, with its modern UI and simplicity, can be a preferred choice, but it lags behind in terms of extensive documentation and community support.”
Ultimately, the choice between Nagios and Sensu depends on the user’s familiarity with the tools, their specific monitoring needs, and their level of comfort with manual configurations. While Nagios offers extensive documentation and a wide-reaching user community, Sensu presents a more modern UI and a simplified setup process. Users must carefully evaluate their requirements and weigh the ease of use, documentation, and community support when making their decision.
Alternatives to Consider
In addition to Nagios and Sensu, there are several alternative monitoring tools that you can explore for your network monitoring needs. These alternatives offer unique features and capabilities that might better suit your specific requirements. Let’s take a look at some of these options:
Icinga
Icinga is a popular fork of Nagios that provides a more modern user interface (UI) and improved features. It offers enhanced scalability and a highly customizable monitoring experience. With Icinga, you can create personalized dashboards and benefit from advanced reporting functionalities. It’s an excellent choice if you’re looking for a monitoring tool that combines the reliability of Nagios with a more user-friendly interface.
Cacti
Cacti is a powerful graphing tool that can also be used for monitoring purposes. It is highly customizable and allows you to create detailed graphs and reports based on the data collected from your network devices. With Cacti, you can visualize trends and analyze performance metrics over time. If you need a tool that focuses on visualizations and graphing capabilities, Cacti is worth considering.
Munin
Munin is another popular graphing tool that offers a wide range of monitoring capabilities. It provides an easy-to-use web interface and supports various plugins for collecting and visualizing performance data. Munin excels in displaying system-level metrics, giving you a comprehensive overview of your network’s performance. If you prefer a simple yet powerful monitoring solution with a focus on system-level monitoring, Munin is a great option.
Zabbix
Zabbix is a widely used monitoring solution known for its extensive features and flexibility. It offers advanced monitoring capabilities, including network and application monitoring, event correlation, and customizable dashboards. With Zabbix, you can monitor various infrastructure components and analyze performance in real-time. If you need a comprehensive monitoring tool with a wide range of features, Zabbix is a strong contender.
When considering alternatives to Nagios and Sensu, it’s important to evaluate your specific monitoring requirements and preferences. Each tool mentioned above brings its own strengths and capabilities to the table. Whether it’s Icinga’s modern UI, Cacti and Munin’s graphing capabilities, or Zabbix’s extensive feature set, you can find a suitable alternative that aligns with your network monitoring needs.
Usability and Support
When evaluating monitoring solutions like Nagios and Sensu, considering usability and support is crucial to ensure a smooth implementation and efficient operation. Both Nagios and Sensu have their own unique characteristics in terms of usability and support.
Nagios Usability
Nagios is a powerful monitoring framework that has been widely used in various environments. However, it has received criticism for its complex configurations and outdated user interface (UI). The learning curve can be steep for new users who are unfamiliar with the intricacies of Nagios. Configuring checks, handlers, and hosts often involves manual updates to configuration files and a restart of the Nagios server.
Despite these challenges, Nagios has a large user base and an active community of users who provide support and share their expertise. The extensive user community contributes to the availability of documentation and online resources for troubleshooting and optimizing Nagios configurations. The strong user base and community support are valuable assets when facing difficulties or seeking guidance in configuring and managing Nagios.
Sensu Usability
On the other hand, Sensu offers a more user-friendly UI and API compared to Nagios. This makes Sensu easier to navigate and operate, especially for users who may not have extensive experience with monitoring solutions. Sensu’s UI is designed to provide a modern and intuitive experience, simplifying the process of configuring checks and managing hosts.
However, it is worth noting that Sensu may have limited documentation and support options compared to Nagios, given its relatively newer presence in the market. While Sensu has its advantages in terms of usability, users relying heavily on documentation or seeking widespread community support may find Nagios more accommodating.
Ultimately, the choice between Nagios and Sensu depends on specific requirements and priorities. Some users may prioritize a user-friendly interface with a relatively moderate learning curve, opting for Sensu. Others may prefer the extensive user community and support options of Nagios, despite its somewhat complex configuration process. It is essential to consider usability and support aspects alongside other factors when making a monitoring solution selection.
Conclusion
After comparing Nagios and Sensu, it is clear that both monitoring solutions have their strengths and weaknesses. When making a choice between the two, it is crucial to consider factors such as scalability, ease of use, community support, and specific network monitoring needs.
Nagios is well-known for its stability and extensive user community. It is particularly suited for large-scale environments with hundreds or thousands of servers. On the other hand, Sensu offers scalability and flexibility, making it ideal for dynamic cloud deployments where hosts come and go frequently.
Ultimately, the decision between Nagios and Sensu depends on personal preferences and individual requirements. It is recommended to assess the scalability requirements, ease of use, and level of community support needed for your network monitoring needs before making a choice. Exploring the features and capabilities of both tools can provide valuable insights to help you make an informed decision.
FAQ
Is Nagios or Sensu better for network monitoring?
What are the key features of Nagios and Sensu?
Which monitoring tool is more performant, Nagios or Sensu?
Are there any user experience differences between Nagios and Sensu?
What are some alternatives to Nagios and Sensu?
Are Nagios and Sensu easy to use and well-supported?
Source Links
- https://stackoverflow.com/questions/9919990/which-is-better-nagios-or-sensu
- https://www.psychz.net/client/question/en/sensu-vs-nagios.html
- https://www.trustradius.com/compare-products/nagios-core-vs-sensu
- About the Author
- Latest Posts
Mark is a senior content editor at Text-Center.com and has more than 20 years of experience with linux and windows operating systems. He also writes for Biteno.com


