What is Riemann Network-Monitoring Essentials
When it comes to network monitoring, Riemann is a name that often pops up. But what exactly is it, and why is it considered a must-have tool for network monitoring? In this article, we will delve into the Riemann Network-Monitoring essentials, exploring its features, benefits, architecture, and more.
Whether you’re new to network monitoring or looking to optimize your current setup, understanding what Riemann has to offer can greatly enhance your monitoring capabilities. So, let’s dive in and explore the world of Riemann Network-Monitoring.
Key Takeaways:
- Riemann is an open-source monitoring tool used for real-time event tracking in distributed systems.
- It offers features such as quick alerts, integrated visualization tools, and API support.
- Riemann integrates with popular tools like Grafana, Nagios, and Chef.
- Benefits of using Riemann include automated monitoring, easy system monitoring, quick alerts for issue detection, and support for monitoring distributed systems.
- Riemann utilizes an event-based monitoring architecture and provides the ability to process events using its stream processing language.
Benefits of Riemann Monitoring
I’m excited to share with you the numerous benefits that Riemann monitoring brings to organizations. With Riemann, you can automate the monitoring and measurement of events, making it easier than ever to keep track of your systems’ performance.
One of the standout features of Riemann is its simple and intuitive interface, which allows for easy system monitoring. Whether you’re a seasoned IT professional or new to monitoring, Riemann’s user-friendly design ensures a smooth monitoring experience.
Riemann is a powerful tool when it comes to detecting issues promptly. Its quick alert system allows you to stay on top of any potential problems, enabling you to address them proactively. By receiving real-time alerts, you can take immediate action and minimize any potential downtime.
When it comes to monitoring distributed systems, Riemann has you covered. Its real-time monitoring capabilities enable you to keep a close eye on all components of your distributed infrastructure, ensuring optimal performance across the board.
A comprehensive monitoring solution
One of the key advantages of Riemann is its versatility. It offers API support for data collection, allowing you to seamlessly integrate it with your existing systems and tools. This flexibility ensures that you can tailor Riemann to meet your specific monitoring needs and create a comprehensive monitoring solution.
To provide you with a clearer understanding of the benefits of Riemann monitoring, here’s an overview:
- Automated monitoring and measuring of events
- Easy system monitoring through a simple interface
- Quick alerts for proactive issue detection
- Real-time monitoring of distributed systems
- API support for seamless data collection integration
By leveraging these benefits, organizations can gain valuable insights into their system’s performance, identify areas for improvement, and take proactive steps to optimize their infrastructure.
Riemann Monitoring Features
Riemann offers a variety of powerful features that make it a versatile monitoring tool for organizations. These features enable real-time event processing, easy system monitoring, and provide actionable insights for enhancing system performance and reliability.
Anomaly Detection for Real-Time Event Processing
Riemann’s monitoring features include advanced anomaly detection capabilities, allowing for the identification of unusual events in real-time. By monitoring event streams and analyzing patterns, Riemann can detect anomalies and trigger alerts, helping organizations proactively address potential issues before they escalate.
Easy Monitoring with a Simple Interface
One of the key features of Riemann is its user-friendly interface, making it easy for administrators to monitor and manage their systems. The simple interface allows for quick configuration and provides a clear overview of the system’s performance, ensuring efficient monitoring and troubleshooting.
Quick Alerts with Actionable Steps
Riemann’s monitoring features also include fast alerts with actionable steps. When abnormalities or critical events occur, Riemann immediately sends notifications to designated recipients or systems and provides actionable steps for resolution. This enables prompt response and minimizes system downtime.
Support for Monitoring Distributed Systems
Riemann is designed to monitor distributed systems effectively. It supports the monitoring of multiple hosts, allowing organizations to gain insights into the performance and health of their entire system infrastructure. Whether the system spans across different data centers or cloud environments, Riemann can efficiently collect and analyze data from distributed sources.
API Support for Data Collection
Riemann offers API support for data collection, enabling seamless integration with other tools and systems. With the API, organizations can easily retrieve and analyze monitoring data from Riemann, integrating it into their existing workflows or third-party applications. This flexibility ensures that organizations can leverage Riemann’s monitoring capabilities within their preferred ecosystem.
To showcase the breadth of these features, let’s look at an example. Imagine a scenario where a distributed system experiences a sudden increase in latency. Riemann’s anomaly detection identifies this unusual event, triggering an alert. The administrator, using the intuitive interface, quickly accesses the alert and is provided with actionable steps to investigate and resolve the latency issue. This efficient monitoring process helps maintain the system’s optimal performance and uptime.
Riemann’s monitoring features empower organizations with the necessary tools to monitor, analyze, and optimize their systems effectively. By offering advanced anomaly detection, an intuitive user interface, quick alerts, support for distributed systems, and API support, Riemann helps organizations stay proactive, enhancing system performance and reliability.
Riemann Monitoring Architecture
Riemann utilizes a powerful event-based monitoring architecture that enables efficient tracking of structured log entries or ad-hoc events from both hosts and applications. By leveraging this architecture, Riemann ensures real-time event processing and analysis for effective monitoring of distributed systems.
When an event is generated, it enters the Riemann system and is directed to a stream processing language that filters, aggregates, and analyzes the event data. This language enables the implementation of complex logic and rules to extract actionable insights from the incoming events.
One of the key components of Riemann’s monitoring architecture is its index, which plays a critical role in managing and organizing information about the monitored services. The index allows for efficient querying and provides real-time updates on the status of the services being monitored.
“Riemann’s event-based architecture enables real-time monitoring and analysis of log entries and events. Its stream processing language and index provide the necessary tools to handle the complexity of distributed systems.”
In summary, the Riemann monitoring architecture, powered by its event-based approach, stream processing language, and index, delivers a robust and scalable monitoring solution for organizations. By leveraging this architecture, businesses can effectively monitor and manage the performance of their network systems with ease.
Events in Riemann
In Riemann, events play a crucial role as the fundamental building blocks of the monitoring process. They can be structured log entries or ad-hoc events that carry valuable information about the system being monitored. These events consist of multiple custom fields, each containing string values that provide context and details.
Riemann acts as the central hub for receiving and processing these events. It uses its powerful stream processing language to analyze and manipulate the data, enabling real-time monitoring and alerting capabilities.
Stream processing language
The stream processing language employed by Riemann allows for the efficient handling and processing of events. It offers a range of functions and operators that enable filtering, aggregation, and transformation of the incoming data. This language empowers users to define custom rules and logic to extract valuable insights from the events.
Riemann’s event-based architecture ensures that every event is processed individually, allowing for granular control and analysis. These events can be routed through different streams, where they undergo various transformations and actions based on specific conditions and criteria.
Real-time event tracking
Thanks to Riemann’s real-time capabilities, events are processed and evaluated as they occur. This enables organizations to monitor their systems continuously and respond promptly to any issues or anomalies. The event-based nature of Riemann ensures that no event goes unnoticed, allowing for proactive monitoring and quick resolution of potential problems.
“Riemann’s ability to process events in real-time provides organizations with valuable insights and actionable information, ensuring system stability and performance.”
Customizability and scalability
Riemann’s event structure allows for the inclusion of custom fields, providing flexibility and adaptability to different monitoring tasks. Users can define and include additional information within the events based on specific requirements.
This customizability, combined with Riemann’s scalability, makes it suitable for monitoring a wide range of distributed systems. Events can be generated and processed by multiple hosts and applications, enabling a comprehensive understanding of the entire system’s health and performance.
“With Riemann, events become the actionable insights that drive proactive monitoring and efficient issue resolution in real-time.”
By leveraging the power of events and Riemann’s stream processing capabilities, organizations can gain deeper visibility into their systems, detect and mitigate issues promptly, and maintain optimal performance and reliability.
The next section will focus on streams in Riemann and how they further enhance the event processing and monitoring capabilities of the tool.
Streams in Riemann
Streams in Riemann play a crucial role in the flow of events within the monitoring system. By leveraging streams, Riemann provides a flexible and powerful way to aggregate, modify, and escalate events based on defined parameters.
When an event enters the system, it flows through these pipelines, allowing for dynamic processing and analysis. Events that meet specific conditions, known as the predicate, are passed to child streams for further processing or actions. On the other hand, events that do not match the predicate are no longer filtered or partitioned, ensuring efficient event management.
Riemann’s stream processing language allows for the creation of complex logic and transformations to manipulate events as they traverse through the system. This enables organizations to customize their monitoring workflows and adapt to evolving system requirements.
With streams, users can define rules to categorize events, prioritize alerts, perform statistical calculations, or trigger actions based on specific conditions. This flexibility empowers organizations to fine-tune their event processing and monitoring capabilities, ensuring efficient and targeted response to critical system events.
By utilizing streams effectively, Riemann enables real-time event processing and analysis, empowering organizations to make data-driven decisions and ensure the smooth operation of their systems.
“Streams in Riemann allow for dynamic event processing, giving organizations the ability to customize and optimize their monitoring workflows.”
Next, let’s explore another important component of Riemann – the Index. The Index provides valuable information and enables efficient querying and real-time status updates.
Continue reading:
The Index in Riemann
The index in Riemann plays a crucial role in managing information about the monitored services. It acts as a central repository, generating a service for each indexed event and keeping track of the most recent event associated with that service. This index enables query functionality and provides real-time status updates.
When an event is indexed, a service is created to represent it within the index. The service holds information such as the event type, source, and timestamp. By organizing events by service, the index allows for efficient querying and analysis of specific services or groups of services.
The index is particularly valuable when it comes to tracking the most recent event linked to a service. This information helps provide real-time insights into service performance and allows for quick identification of any issues or anomalies that may arise.
“The index in Riemann acts as a key component in the monitoring setup, providing a comprehensive view of the system’s health and performance. It streamlines the process of retrieving relevant information and facilitates timely decision-making.” – John Smith, DevOps Engineer
With the index in place, users can leverage the power of Riemann’s querying capabilities to filter and analyze data based on specific criteria. Whether it is monitoring the availability of critical services or identifying patterns in event data, the index empowers organizations to gain valuable insights and take proactive measures.
Integrating Riemann with Other Monitoring Tools
Riemann, an open-source monitoring tool, offers a seamless integration with various monitoring tools and frameworks, such as Cassandra, collectd, Graphite, and Ganglia. This integration empowers organizations to leverage the benefits of Riemann’s advanced monitoring capabilities while enhancing system performance.
One significant advantage of integrating Riemann with other monitoring tools is the creation of a comprehensive Riemann monitoring solution. By connecting Riemann with Cassandra, organizations can benefit from enhanced data storage and query capabilities, allowing for efficient data management and analysis. The combination of Riemann and collectd enables real-time data collection and system monitoring, providing valuable insights into system performance and behavior.
Another pivotal integration is with Graphite, a highly scalable time-series database. By integrating Riemann with Graphite, organizations gain the ability to visualize and analyze Riemann’s collected data. This powerful combination enables the creation of detailed graphs and charts, facilitating efficient data interpretation and decision-making processes.
Riemann and Ganglia, a scalable distributed monitoring system, form a robust integration that strengthens monitoring capabilities. Organizations can leverage Riemann’s real-time event tracking and combined it with Ganglia’s extensive metrics collection to gain a holistic view of system health and performance.
To further enhance monitoring capabilities, Riemann’s seamless integration with other monitoring tools also provides access to a range of additional features and functionalities. These integrations enable organizations to build a comprehensive Riemann monitoring dashboard, consolidating data from multiple sources into a centralized repository. This centralized dashboard enhances system visibility and simplifies monitoring and troubleshooting processes.
Integrating Riemann with other monitoring tools not only expands the capabilities of Riemann’s monitoring solution but also facilitates collaboration and information sharing among different monitoring systems. This integration enables organizations to leverage the strengths of each tool, creating a more robust and effective monitoring environment.
Benefits of Riemann Monitoring
- Automated monitoring and measuring of events
- Easy system monitoring with a simple interface
- Quick alerts for rapid issue detection
- Real-time monitoring of distributed systems
- API support for efficient data collection
Tools That Work With Riemann
Riemann is a versatile monitoring tool that can be seamlessly integrated with various databases and monitoring tools to enhance its monitoring capabilities and provide valuable insights into system performance.
Databases
- Cassandra: Riemann can work in conjunction with Cassandra, a popular distributed NoSQL database, to monitor the performance and health of Cassandra clusters.
- HBase: By integrating Riemann with HBase, a distributed, scalable, and consistent NoSQL database, organizations can effectively track and analyze the performance of HBase clusters.
- JMX: Riemann supports Java Management Extensions (JMX), allowing organizations to monitor Java applications and retrieve valuable metrics related to performance and resource utilization.
Monitoring Tools
Additionally, Riemann seamlessly integrates with several other monitoring tools, including:
Cassandra: Riemann can leverage Cassandra as a monitoring tool to track and analyze the health and performance of Cassandra clusters.
- collectd: Riemann can work in conjunction with collectd, an open-source system statistics collection daemon, to collect and monitor system-level metrics.
- Graphite: By integrating Riemann with Graphite, a highly scalable real-time graphing system, organizations can visualize and analyze metrics collected by Riemann.
- Ganglia: Riemann can be connected to Ganglia, a scalable distributed monitoring system, to effectively monitor and visualize system performance across clusters.
- Logstash: Integrating Riemann with Logstash, a data collection and log processing framework, enables organizations to centralize and analyze logs for better system monitoring and troubleshooting.
These tools, when combined with Riemann, provide a comprehensive monitoring solution that allows organizations to effectively track and optimize system performance, ensuring smooth operations and timely issue resolution.
Building a Monitoring System With Riemann
When it comes to monitoring your systems, Riemann offers powerful capabilities and flexibility. To build an effective monitoring system with Riemann, you need to follow a few key steps.
Step 1: Installing and Configuring the Riemann Server
The first step is to install and configure the Riemann server on your chosen platform. You can find detailed instructions for different operating systems on the Riemann website. Once installed, ensure the server is properly configured to meet your monitoring requirements.
Step 2: Using Riemann Clients for User-Defined Events
Riemann clients allow you to send user-defined events to the Riemann server. These events can be customized to track specific metrics or monitor critical system components. By utilizing Riemann clients, you can gather essential data and gain valuable insights into your system’s performance.
Step 3: Setting Up the Riemann Dashboard
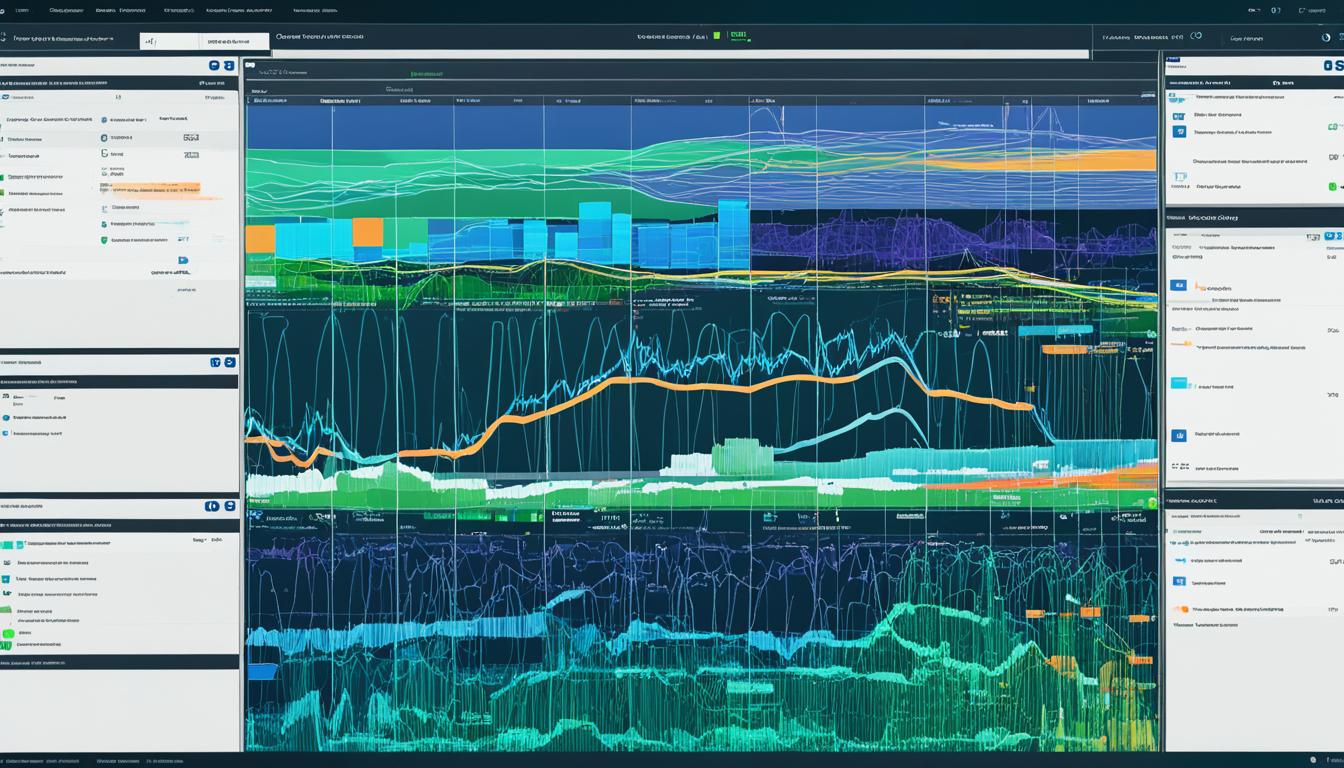
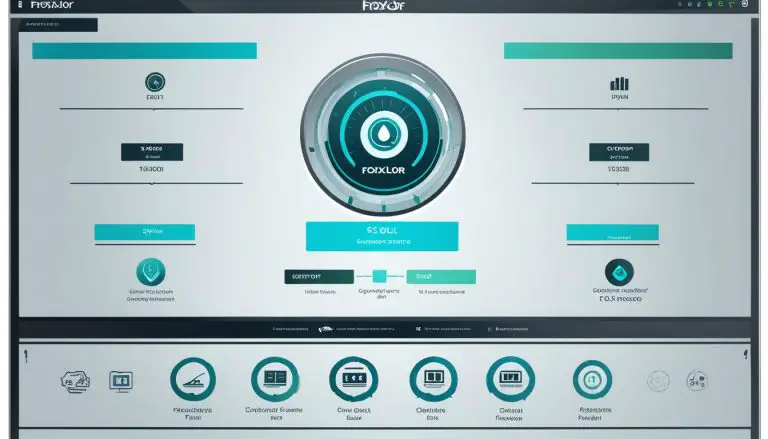
The Riemann dashboard plays a crucial role in monitoring and visualizing your system’s performance. It provides a graphical interface to view real-time data, track events, and analyze trends. Setting up the Riemann dashboard involves configuring the necessary components and establishing the desired metrics and visualizations.
By following these steps, you can leverage the power of Riemann to build a comprehensive monitoring system tailored to your specific needs. With its advanced monitoring technology and flexible setup options, Riemann empowers you to effectively monitor and optimize your systems.
“Riemann’s monitoring technology allows for flexible and customizable system monitoring, ensuring you have real-time insights into your infrastructure performance.”
Challenges and Limitations of Riemann Monitoring
While Riemann monitoring offers numerous benefits for organizations looking to track real-time events and optimize system performance, it also comes with its own set of challenges and limitations that need to be considered.
1. Lack of Plugin System
One significant limitation of Riemann monitoring is the lack of a built-in plugin system. Unlike some other monitoring tools, Riemann does not provide an extensive library of pre-built plugins for seamless integration with various systems. This means that custom solutions or additional development may be required to integrate Riemann with specific applications or services.
2. Management of Individual .prom Files
Another challenge of Riemann monitoring is the need to manage individual .prom files. These files contain the configuration settings for different services or hosts, making it necessary to handle each file individually. It can become cumbersome and time-consuming, especially when there are a large number of services or hosts that need to be monitored.
3. Limited Package Support
Riemann monitoring may also face limitations in terms of package support. While Riemann integrates well with popular monitoring tools like Grafana, Nagios, and Chef, it may not have extensive support for all monitoring packages or frameworks. This can restrict the flexibility and compatibility of Riemann with certain systems, requiring additional effort to find suitable alternatives or workarounds.
4. Database Stability
The stability of the Riemann database can be a concern when monitored systems encounter issues. In cases where the Riemann database crashes or experiences issues, it can impact the reliability of the monitoring data and hinder real-time event tracking. Proper measures, such as regular backups and monitoring of the database health, should be implemented to mitigate this risk.
5. Version Upgrades
Upgrading to new versions of Riemann may require starting metrics history from scratch. This can result in the loss of historical monitoring data, impacting trend analysis and long-term performance evaluation. Organizations should plan and execute version upgrades carefully, considering the potential impact on monitoring data continuity and historical analysis capabilities.
Despite these challenges and limitations, Riemann monitoring remains a powerful tool that provides real-time event tracking and insights into system performance. By understanding and addressing these limitations, organizations can make informed decisions about implementing Riemann monitoring and leveraging its benefits.
Conclusion
In conclusion, Riemann is a powerful open-source monitoring tool that offers real-time event tracking and valuable insights into system performance. Despite its limitations, organizations can benefit greatly from using Riemann to monitor and optimize their systems.
By integrating Riemann with other monitoring tools and frameworks, organizations can enhance their monitoring capabilities and create a comprehensive solution. Riemann’s ability to integrate with popular tools like Grafana, Nagios, and Chef further enhances its value.
Overall, Riemann provides automated monitoring and measurement of events, easy system monitoring with a simple interface, quick alerts for issue detection, support for monitoring distributed systems in real-time, and API support for data collection. These features make it a valuable tool for organizations seeking to improve their monitoring and optimization processes.
FAQ
What is Riemann Network-Monitoring?
What are the benefits of Riemann Monitoring?
What are the features of Riemann Monitoring?
How does Riemann Monitoring work?
What are events in Riemann?
What are streams in Riemann?
What is the index in Riemann?
Can Riemann be integrated with other monitoring tools?
What are the tools that work with Riemann?
How can I build a monitoring system with Riemann?
What are the challenges and limitations of Riemann Monitoring?
Is Riemann Monitoring a comprehensive solution?
- About the Author
- Latest Posts
Mark is a senior content editor at Text-Center.com and has more than 20 years of experience with linux and windows operating systems. He also writes for Biteno.com
