Zabbix vs. Nagios: Unveiling the Best IT Tool
When it comes to network monitoring tools, Zabbix and Nagios are two popular choices that often come up in discussions. Both open-source options offer a plethora of features and capabilities to help IT professionals monitor their systems effectively. But which one is truly the best tool for your needs? In this article, we will delve into the comparison between Zabbix and Nagios, explore their key features, scalability, performance metrics, alerting systems, and monitoring capabilities, and ultimately uncover the answer to this pressing question.
Are you curious to know which network monitoring tool comes out on top in the battle between Zabbix and Nagios? How does their performance and scalability measure up? And what are the unique features and capabilities that set them apart? Join me as we delve into the world of Zabbix and Nagios to find the ultimate IT monitoring champion.
Key Takeaways:
- Zabbix and Nagios are popular open-source network monitoring tools that offer extensive features and capabilities.
- Comparing their performance and scalability can help determine the best fit for your IT needs.
- Understanding the unique features and monitoring capabilities of each tool is crucial in making an informed choice.
- Alerting systems are essential for timely notifications of outages or critical events.
- Consider the specific requirements and preferences of your organization when deciding between Zabbix and Nagios.
Introduction to Nagios
Nagios, a well-established and reliable network monitoring tool, has been a leader in the industry for many years. With two versions available, Nagios Core and Nagios XI, it offers a comprehensive suite of features to meet various monitoring needs.
Nagios Core, the free version, empowers users to monitor a wide range of network components, including devices, servers, applications, and operating systems. Its web-based dashboard provides a centralized location for monitoring information and customizable views, ensuring real-time visibility into network performance.
Building upon the capabilities of Nagios Core, Nagios XI offers additional advanced features. Integration with enterprise tools allows for seamless collaboration and enhanced monitoring capabilities. The capacity planning feature empowers organizations to anticipate and proactively manage resource allocation. Trending graphs offer valuable insights into performance patterns, enabling timely decision-making.
One of the key strengths of Nagios is its alerting system, which promptly notifies stakeholders and end-users of outages or critical events. This ensures that any issues can be quickly addressed, minimizing downtime and mitigating potential risks.
Furthermore, Nagios offers a web-based configuration interface, simplifying the setup and customization process. This user-friendly interface allows administrators to easily tailor the monitoring system to their specific network environment.
Additionally, Nagios supports integration with third-party applications, enabling seamless collaboration with existing tools and systems. This flexibility ensures that Nagios can adapt to various IT environments and align with organizational needs.
Overall, Nagios provides a robust and feature-rich solution for network monitoring. With its diverse range of features, from its dashboard and trending graphs to its alerting system and integration capabilities, Nagios is a reliable choice for organizations seeking comprehensive network monitoring tools.
I will now proceed to the next section, where I will introduce Zabbix and its key features.
Introduction to Zabbix
Zabbix is a popular open-source network monitoring tool that provides comprehensive monitoring capabilities for networks, servers, applications, and services. It offers a wide range of features that make it a powerful choice for IT professionals.
One of the key features of Zabbix is its auto discovery functionality. This feature allows Zabbix to automatically detect and add new devices, servers, and services to the monitoring system. It simplifies the monitoring process, saving time and effort for administrators.
Zabbix supports various protocols, including SNMP (Simple Network Management Protocol), which enables it to monitor a wide range of network parameters, such as bandwidth usage, network latency, and device performance.
With Zabbix, you can take advantage of monitoring templates, which provide pre-configured monitoring settings for different types of devices or applications. These templates make the setup process faster and easier, ensuring that you have comprehensive monitoring coverage.
Scalability is another noteworthy aspect of Zabbix. It is designed to handle large networks with thousands of devices and servers. Its robust architecture and distributed monitoring capabilities ensure that you can scale your monitoring infrastructure as your network expands.
Furthermore, Zabbix allows the execution of remote scripts. This feature enables administrators to run custom scripts on monitored devices or servers, empowering them to automate tasks, collect additional data, or perform specific actions based on monitoring results.
Zabbix also excels in integration with third-party software. It seamlessly integrates with various applications such as trouble ticketing systems, inventory systems, and popular IT service management (ITSM) platforms. This integration enhances workflow efficiency and enables you to leverage existing tools within your IT ecosystem.
Zabbix is a robust and feature-rich network monitoring tool. Its auto discovery capability, support for SNMP, monitoring templates, scalability, remote script execution, and integration with third-party software make it a versatile choice for IT teams.
Feature Comparison – Configuration and User Interface
When comparing the configuration and user interface of Nagios Core, Nagios XI, and Zabbix, we find distinct differences in their approaches and ease of use.
Configuration: Nagios Core relies on configuration text files, which can be time-consuming and require manual editing. On the other hand, Zabbix offers a web-based interface that simplifies the configuration process. With its intuitive interface, users can easily make changes and updates to their monitoring settings.
User Interface: Nagios Core provides a basic web-based interface that focuses primarily on monitoring and reporting. However, Nagios XI and Zabbix offer robust, modern web interfaces that not only facilitate monitoring but also allow for configuration changes. This makes Zabbix a more user-friendly option, providing a seamless experience for users to monitor, configure, and manage their network monitoring systems.
To illustrate the differences, imagine you’re setting up network monitoring for your organization using Nagios Core. You’ll need to work with complex configuration text files, and any changes or updates will require manual modifications. On the other hand, with Zabbix’s web-based interface, you can easily configure and fine-tune the monitoring settings without diving into the intricacies of configuration files.
The user interface is another aspect where Zabbix shines. While Nagios Core’s interface is functional, it may feel outdated or limited for users accustomed to modern web interfaces. Nagios XI and Zabbix, however, provide visually appealing and feature-rich web interfaces that enhance the user experience. These interfaces offer comprehensive configuration capabilities, empowering users to customize their monitoring systems according to their specific needs.
In terms of ease of use and configuration, Zabbix surpasses Nagios Core. Zabbix’s web-based interface streamlines the configuration process and provides a more user-friendly experience, making it an ideal choice for those seeking a seamless and efficient network monitoring solution.
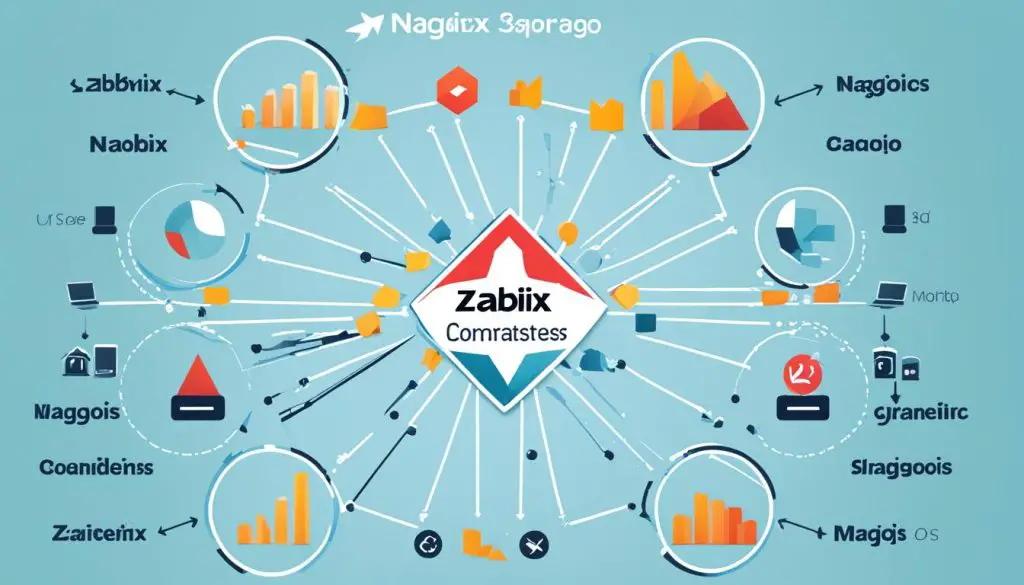
If you’re interested in seeing a visual representation of the differences between Nagios Core and Zabbix, take a look at the image below:
Feature Comparison – Alerting and Monitoring Capabilities
When it comes to alerting, both Nagios Core and Zabbix offer email alerts and SMS alerts to promptly notify users of any outages or critical events. These notification methods allow for immediate action and ensure that relevant stakeholders are informed in real-time.
In terms of monitoring capabilities, both Nagios Core and Zabbix perform exceptionally well. They both support SNMP monitoring, which allows for comprehensive tracking of network device performance. SNMP monitoring plays a crucial role in monitoring critical infrastructure components and enables the detection of device failures or abnormal behavior.
One distinguishing feature of Zabbix is its auto-discovery capability. With this feature, Zabbix can automatically detect and monitor new devices or services added to the network. This can be particularly useful for organizations with large networks, as it reduces the manual effort required to configure and monitor individual devices.
Overall, both Nagios Core and Zabbix provide robust alerting and monitoring capabilities. However, Zabbix goes one step further by offering the additional functionality of auto-discovery, which can greatly simplify network management and monitoring tasks.
Feature Comparison – Graphs and Reporting
Graphs and reporting are essential features in network monitoring tools. Both Nagios Core and Zabbix offer useful capabilities in this regard.
Nagios Core utilizes the NagVis plugin to generate graphs, providing users with visual representations of performance and trends in their network. These graphs offer valuable insights into the health and status of monitored components.
On the other hand, Zabbix includes built-in graphing capabilities, eliminating the need for additional plugins. This makes it more convenient for users, as they can access and interpret graphs directly within the tool.
Zabbix also excels in terms of flexibility and customization options for graphs and reporting. Users can tailor the visual representation of data according to their specific requirements. This level of customization enhances the usability and effectiveness of the monitoring tool.
Additionally, Zabbix offers monitoring templates for different services, further streamlining network management. These templates provide pre-configured settings for monitoring specific components or applications, saving time and effort for administrators.
By utilizing robust graphing and reporting features, both Nagios Core and Zabbix empower IT teams to track network performance, identify trends, and make informed decisions to optimize their networks.
“Graphs and reporting are integral components of network monitoring tools. They allow us to visualize data and gain insights into critical metrics.” – Network Administrator
With the ability to generate graphs and provide customizable reporting, Nagios Core and Zabbix equip IT professionals with the necessary tools to monitor and analyze their networks effectively.
Graphs and reporting in network monitoring tools can be pivotal in understanding network performance, identifying bottlenecks, and making data-driven decisions for network optimization.
Feature Comparison – Plugins and Integration
Plugins and integration are key factors to consider when comparing Nagios Core and Zabbix in terms of customization and compatibility with third-party software.
Nagios Core, being a well-established network monitoring tool, offers a wide range of plugins that can be utilized to extend its functionality. These plugins allow for extensive customization and integration with third-party software, providing users with the flexibility to adapt Nagios Core to their specific needs. Whether it’s integrating with ticketing systems or incorporating additional monitoring capabilities, Nagios Core’s plugin ecosystem offers a solution for almost any requirement.
On the other hand, Zabbix takes a slightly different approach. While it doesn’t rely on plugins as heavily as Nagios Core, it still offers seamless integration with third-party software. Zabbix provides built-in features that enable integration with other systems, allowing for a streamlined workflow and enhanced functionality. From trouble ticketing systems to inventory management tools, Zabbix can be easily integrated to complement existing workflows and drive efficient monitoring processes.
Both Nagios Core and Zabbix prioritize customization and integration, empowering users to tailor their monitoring solutions to their specific requirements. While Nagios Core offers a comprehensive plugin library, Zabbix’s built-in integration capabilities make it a versatile choice for organizations seeking seamless compatibility with third-party software.
Customization through Plugins
Nagios Core’s extensive collection of plugins allows users to customize their monitoring environment. These plugins offer the ability to extend Nagios Core’s core functionality and add specific monitoring capabilities based on individual needs. From custom checks to advanced reporting, plugins provide the flexibility to adapt Nagios Core to unique monitoring requirements.
Seamless Integration with Third-Party Software
Zabbix’s integration capabilities enable it to seamlessly connect with various third-party software applications. This integration extends Zabbix’s functionality and allows for easy data exchange with other systems, facilitating a more efficient and cohesive monitoring environment.
In conclusion, both Nagios Core and Zabbix offer options for customization and integration with third-party software. Nagios Core leverages plugins for extensive customization, while Zabbix focuses on seamless integration. The choice between the two ultimately depends on the specific needs and requirements of your organization, but rest assured that they provide the necessary flexibility to adapt to your monitoring ecosystem.
Scalability and Performance Comparison
When it comes to monitoring large networks, both Nagios Core and Zabbix offer scalability options that can handle the demands of these environments. Nagios XI, the enterprise version of Nagios, provides additional features to enhance scalability, such as the use of a proxy server to distribute the monitoring load effectively. This allows for efficient monitoring of large networks by reducing the strain on individual servers or devices. Zabbix, on the other hand, is known for its ability to serve very large networks and has built-in scalability features that enable it to handle the monitoring needs of expansive infrastructures.
Performance is a critical aspect of network monitoring tools, and both Nagios Core and Zabbix have their own strengths in this area. Nagios Core is highly efficient and has low resource usage, making it an ideal choice for environments where resource constraints are a concern. It excels in providing reliable and real-time monitoring data without putting excessive strain on the system. Zabbix, on the other hand, utilizes a database for storing monitoring results, which allows for more comprehensive and detailed data analysis over time. While the database may grow in size as more monitoring data is collected, it provides the advantage of generating insightful reports and enabling long-term performance analysis.
Overall, both Nagios Core and Zabbix offer excellent scalability and performance capabilities for network monitoring. Nagios XI’s proxy server feature contributes to the scalability of the tool, making it suitable for large networks with distributed monitoring requirements. Zabbix’s database-driven approach enhances performance with robust data storage and analysis capabilities. Depending on your specific needs and network size, you can choose the tool that aligns best with your scalability and performance goals.
Throughout this article, we have explored various aspects of Zabbix and Nagios, two popular network monitoring tools. From comparing features to examining scalability and performance, we have provided insights to help you make an informed decision about the tool that suits your organization’s needs. In the next section, let’s dive deeper into the comparison by exploring the features and capabilities of Icinga, another notable network monitoring tool.
Comparison with Icinga
When it comes to network monitoring tools, Icinga is another highly regarded option that originated from Nagios. Although Icinga shares many similarities with Nagios Core, it offers additional capabilities and features that set it apart.
Icinga excels in its user interface, providing a more intuitive and user-friendly experience compared to Nagios Core. The web user interface of Icinga allows for easier navigation and configuration, making it more accessible for users of all levels of expertise.
“Icinga’s web user interface significantly improves the overall user experience. It simplifies the monitoring process and enhances usability, bringing a fresh, modern feel to network monitoring.”
Additionally, Icinga is considered to be more object-oriented, which means it focuses on managing objects or entities that represent real-world elements in your network. This approach allows for more flexible and efficient management of complex systems and network components.
Scalability is another area where Icinga shines. With features like active/passive clustering and zone-based monitoring, Icinga offers enhanced scalability options for growing networks. These features ensure that Icinga can handle the increasing demands of your network without compromising performance or reliability.
Icinga also provides a powerful web user interface that offers a highly responsive and customizable user experience. The web user interface of Icinga enables real-time monitoring and provides detailed insights into the health and performance of your network.
Overall, both Nagios Core and Icinga are powerful and robust network monitoring tools. However, Icinga stands out with its more intuitive web user interface, object-oriented approach, and advanced scalability features. If you are looking for a user-friendly tool that offers advanced capabilities and seamless scalability for your network monitoring needs, Icinga is definitely worth considering.
<!– list of references, if applicable (use the
-
- tag) –><!– additional resources related to the section, if applicable (use the
-
- tag) –>
-
Conclusion
In conclusion, both Zabbix and Nagios are powerful open-source network monitoring tools with their own unique features and capabilities. Nagios offers a long history and a large user community, making it a tried and tested choice for many organizations. With extensive customization options through plugins, Nagios provides the flexibility needed to tailor the monitoring experience to specific requirements.
Zabbix, on the other hand, stands out with its user-friendliness and advanced features. The intuitive web interface makes it easy for both seasoned professionals and newcomers to navigate and configure the tool. The auto-discovery feature saves time and effort by automatically identifying devices and services, making it highly scalable for large networks.
When it comes to performance, Nagios Core is known for its efficiency and low resource usage, while Zabbix’s use of a database for storing monitoring results provides robust scalability. Both tools offer strong alerting and monitoring capabilities, supporting email and SMS notifications for outages or critical events.
Customization is another key consideration. Nagios Core’s extensive plugin library allows for extensive tailoring and integration with third-party software, providing endless possibilities for enhancing functionality. Zabbix, while not reliant on plugins to the same extent, still offers the flexibility to integrate with other systems and provides users with an array of customization options.
Ultimately, the choice between Zabbix and Nagios depends on your specific IT needs, requirements, and preferences. Consider factors such as the size and complexity of your network, the level of customization desired, and the importance of user-friendliness. Research and evaluate both tools thoroughly to make an informed decision that aligns with your organization’s monitoring goals and objectives.
Additional Resources:
-
-
-
- Nagios XI Official Website: https://www.nagios.com/products/nagios-xi/
- Zabbix Official Website: https://www.zabbix.com/
- Icinga Official Website: https://icinga.com/
-
-
Additional Information and Resources
For additional information and resources on network monitoring tools, you can visit the official websites of Nagios XI, Zabbix, and Icinga. These websites provide detailed documentation, tutorials, and forums where you can find answers to specific questions or gather more insights into the features and capabilities of these tools.
Additionally, there are various online communities and forums dedicated to network monitoring tools, where you can engage with other users and professionals to share experiences and gain further knowledge. These communities provide valuable resources and a platform for discussions regarding network monitoring, troubleshooting, and best practices.
Whether you are an IT professional looking to optimize your organization’s network monitoring or an enthusiast exploring different tools, these additional resources can provide valuable information and insights to help you make informed decisions and enhance your network monitoring capabilities.
FAQ
What is the difference between Nagios Core and Nagios XI?
What is the difference between Zabbix and Nagios?
Can Nagios and Zabbix monitor networks, servers, and applications?
Which tool has a more user-friendly interface for configuration changes?
Do Nagios and Zabbix support SNMP monitoring?
Do Nagios and Zabbix offer alerting capabilities?
Which tool has more advanced graphing and reporting capabilities?
Can Nagios and Zabbix integrate with third-party software?
Which tool is more scalable for large networks?
Is Icinga a suitable alternative to Nagios Core?
Which tool should I choose between Zabbix and Nagios?
Where can I find additional information and resources on network monitoring tools?
- About the Author
- Latest Posts
Katharina arbeitet und schreibt als Reise-Journalistin und Medien-Bloggerin bei der Web-Redaktion.net. Sie reist leidenschaftlich gerne und bloggt darüber unter anderem auf Reisemagazin.biz.
